Global Renewable Energy
Live Example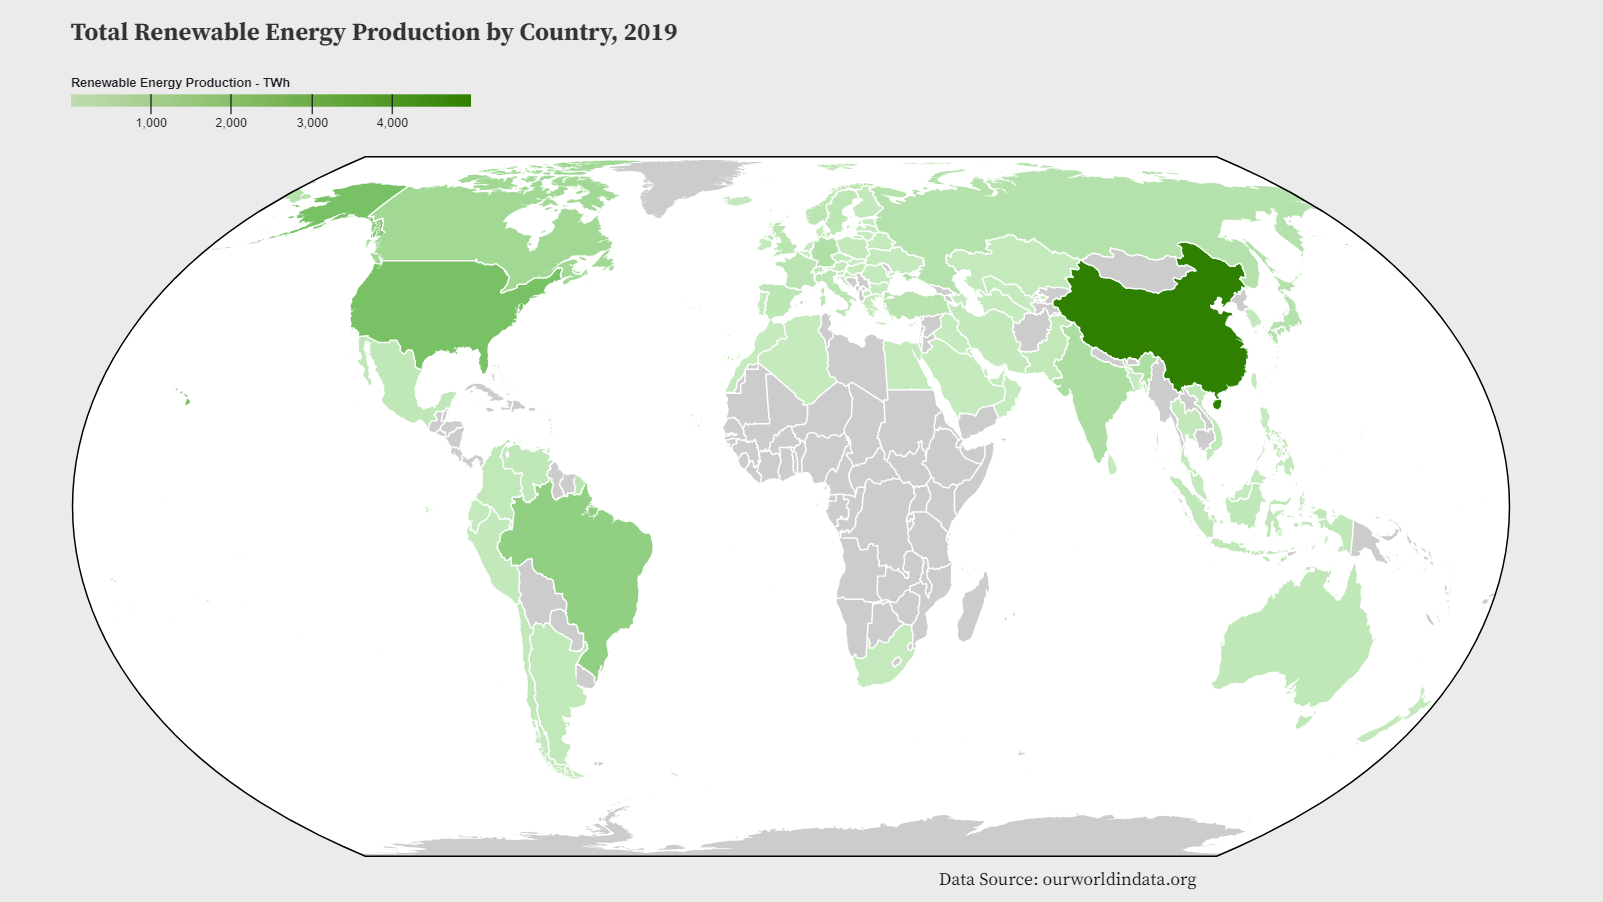
About the Project
Renewable Energy Around the World is a project I completed as a member of the Michigan Data Science Team (MDST) at the University of Michigan. I worked on a team of four people, and we were all eager to learn and get our hands dirty with data visualization. We created several interactive data visualizations that we presented in an article on Observable as we explored and analyzed renewable energy trends around the world.
Technologies Used
- D3.js to process data and create the interactive visualizations. This was my first time working with D3.js, so it wasn't the smoothest experience. The final products all look amazing and the amount of control you get when making the visualizations is unparalleled, but it had me wondering whether all the wrangling and debugging was worth it when there are many solid plotting libraries out there that make things much easier.
- JavaScript to handle the necessary logic.
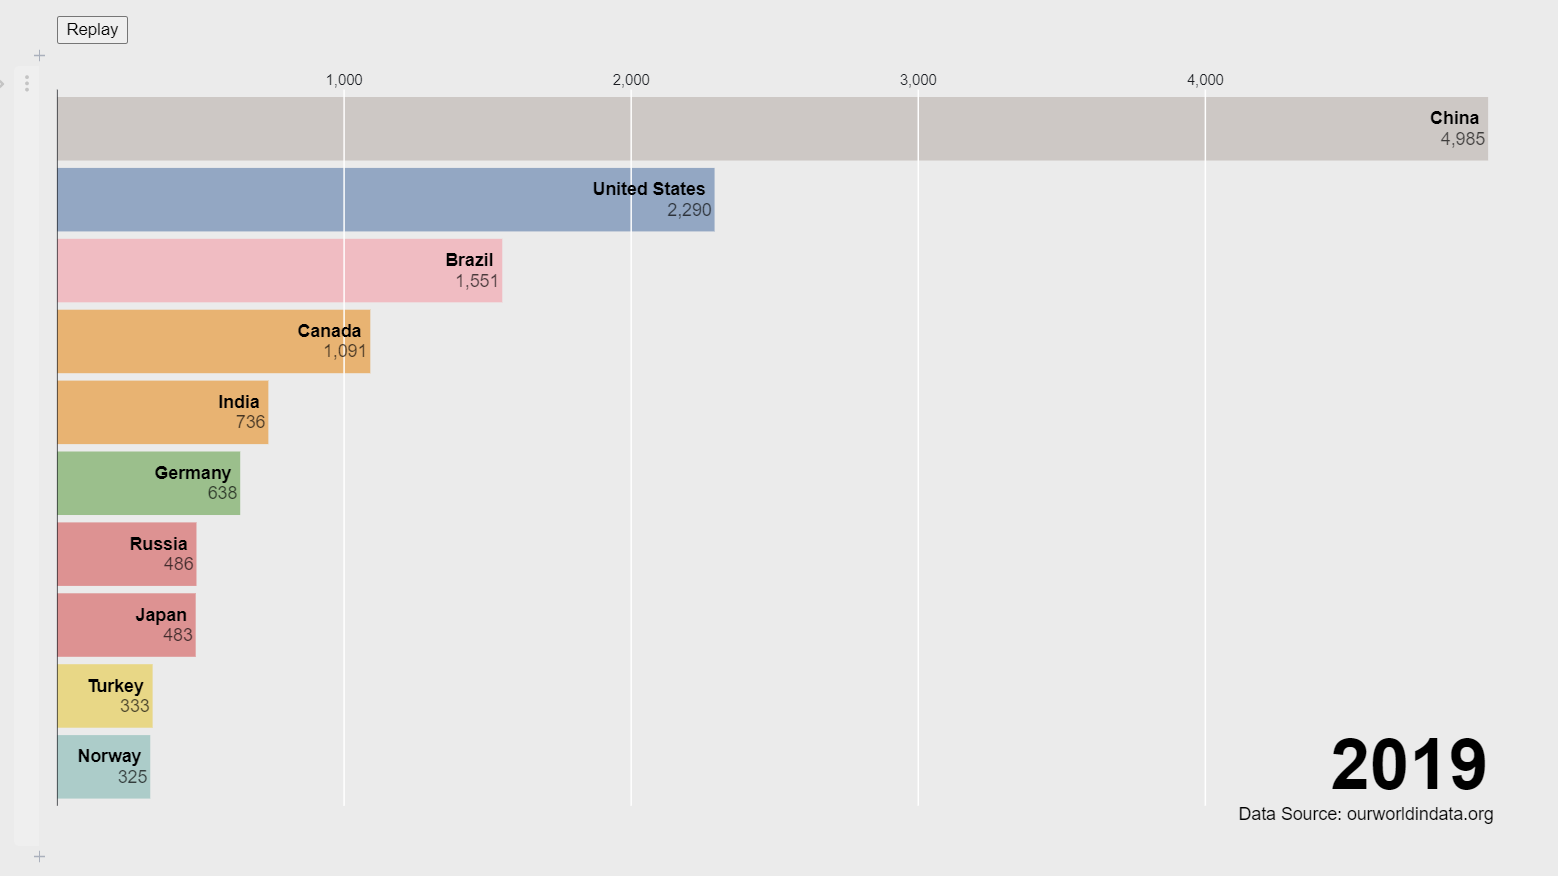
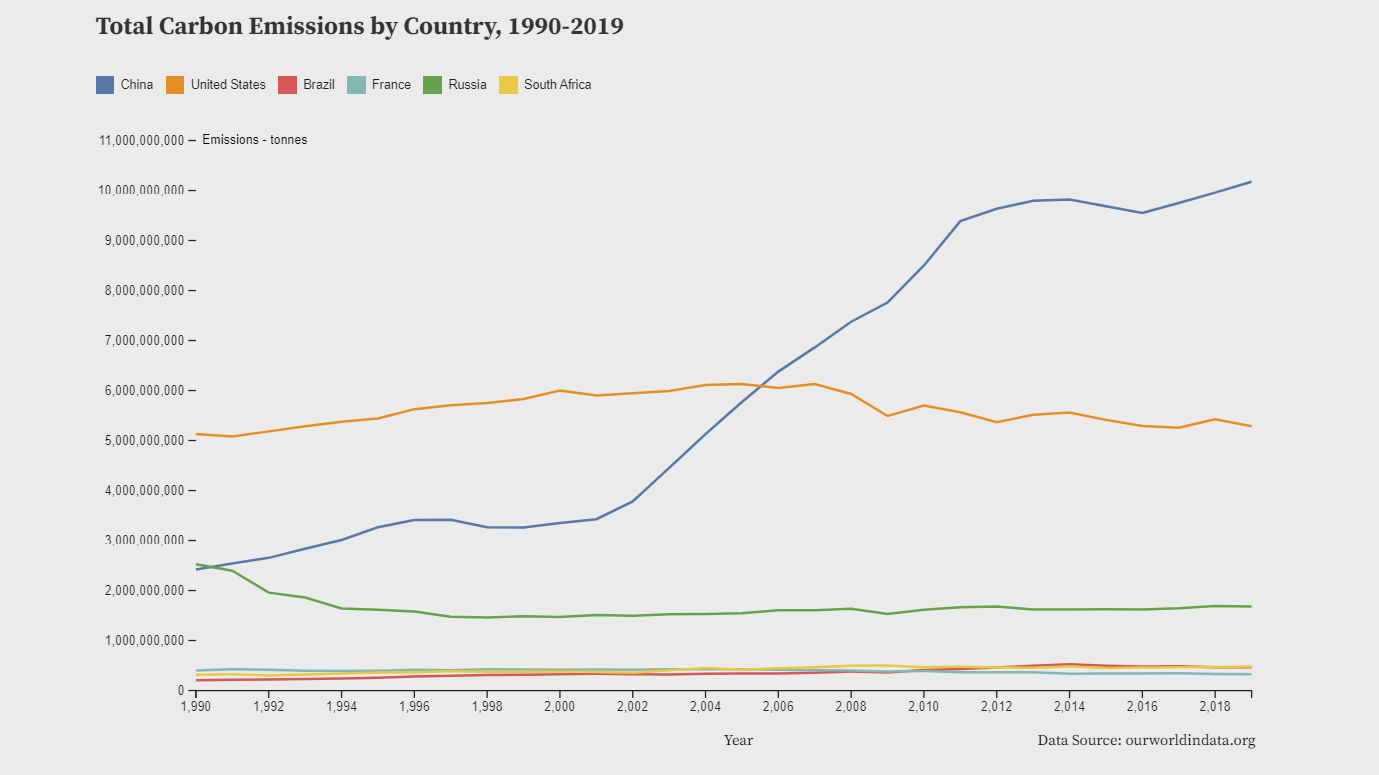
Screenshots